Reports of Investigations
-
Books & Reports
- Reports of Investigations
- Guidebooks
- Udden Series
- Geological Circulars
- Down To Earth
- Atlases of Major Oil and Gas Reservoirs
- Texas Memorial Museum Publications
- Environmental Geologic Atlas of the Texas Coastal Zone
- Mineral Resource Circulars
- Other Reports
- Seminars and Workshops
- Handbooks
- Submerged Lands of Texas
- Symposia
- Annual Reports
- Open File Reports
-
Maps & Cross Sections
- Thematic Maps
- Miscellaneous Maps, Charts & Sections
- Geologic Atlas of Texas
- STATEMAP Project Maps
- Geologic Quadrangle Maps
- Cross Sections
- Highway Geology Map
- Energy and Mineral Resource Maps
- Shoreline Change and Other Posters
- Wilcox Group, East Texas, Geological / Hydrological Folios
- Bouguer Gravity Atlas of Texas
- River Basin Regional Studies
- Featured Maps
- Posters
- Teachers & the Public
-
Geological Society Publications
- Gulf Coast Association of Geological Societies
- Alabama Geological Society
- Austin Geological Society
- Corpus Christi Geological Society
- Houston Geological Society
- Lafayette Geological Society
- Mississippi Geological Society
- New Orleans Geological Society
- South Texas Geological Society
- GCS SEPM Publications
- Historic BEG & UT Series
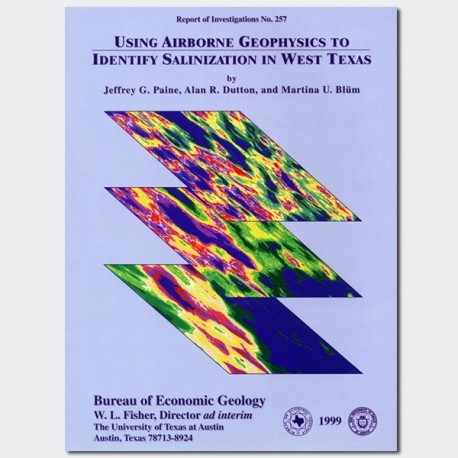
RI0257. Using Airborne Geophysics to Identify Salinization in West Texas, by J. G. Paine, A. R. Dutton, and M. U. Blum. 69 p., 59 figs., 2 tables, 3 appendices, 1999. Print.
To purchase this publication as a downloadable PDF, please order RI0257D.
ABSTRACT
Salinization of soil and water is a chronic environmental and agricultural problem in arid regions. In this study of a 91-km2 area in Runnels County, Texas, we integrated high-resolution airborne and ground-based geophysical surveys and chemical analyses of soil and water to identify near-surface salinization and determine its origin. Possible causes of salinization are migration of brine alongnatural conduits (faults, fractures, joints, and permeable stratigraphic units), infiltration from brine-disposal pits and leaking oil and gas wells, and evaporative concentration of shallow ground water.
An airborne geophysical survey of the Hatchel area, where more than 700 oil and gas wells have been drilled since the 1920's, measured magnetic-field intensity and ground conductivity at three electromagnetic frequencies to identify (1) conductivity anomalies caused by salinization and (2) magnetic-field anomalies caused by well casings and other ferrous objects. Water samples were analyzed to verify airborne data and distinguish salinity types. We combined airborne geophysical data with oil- and gas-well locations to identify 107 conductivity anomalies consistent with oil-field salinization.
Ground-based geophysical measurements, aerial-photograph interpretations, and record inspections of 54 anomalous sites revealed that at least 42 had oil-field salinization and that 22 might be wells that are leaking or have leaked in the past.
We created a geophysical "profile" that captured 20 of the 22 potentially leaking wells identified during field investigations: a site that (1) has a magnetic anomaly or a known well location and (2) has anomalously high conductivity as measured by the high- and intermediate-frequency (56,000- and 7,200-Hz) airborne coils. These results suggest that airborne geophysics can be combined with well locations for identifying most potentially leaking wells without requiring ground investigations at every anomaly.
Used alone, airborne methods distinguish natural salinization from oil-field salinization but have difficulty discriminating among oil-field sources (pits, spills, and leaking wells). Used alone, ground-based surveys can map salinization extent and determine whether wells might be leaking, but unknown salinization is missed. In small areas where well locations are known, ground-based surveys can determine which wells might be leaking, and they are an inexpensive alternative to airborne surveys. Airborne methods are most effective in typical oilfield areas of tens to hundreds of square kilometers, where well locations are uncertain or multiple salinity sources are expected. Airborne data can be used to determine the extent and intensity of salinization, locate source areas, focus ground investigations, and estimate chloride mass in the ground.
Keywords: airborne geophysics, electromagnetic induction, oil-field pollution, salinization, water quality
CONTENTS
ABSTRACT
INTRODUCTION
Geology and Soils
Hydrogeology
Causes of Salinization
Oil and Gas Activity
GEOPHYSICAL METHODS
Airborne Geophysics
Ground-Based Geophysics
Single- and Multiple-Frequency Conductivity Profiling
Time-Domain EM Soundings
WATER AND SOIL SAMPLING
RESULTS
Airborne Geophysical Survey
Magnetic Field Data
EM Data
56,000-Hz Vertical Dipole Data
7,200-Hz Vertical Dipole Data
900-Hz Vertical Dipole Data
Regional Conductivity Patterns and Local Anomalies
Site Selection
Regional Conductivity Patterns
Northwest Low Conductivity Zone
Central Conductive Zone
East-Southeast Low-Conductivity Zone
Known Wells Having Conductivity and Magnetic Anomalies
Site 76
Site 34
Site 43
Site 51
Conductivity and Magnetic Anomalies
Site 17
Site 71
Known Wells with Conductivity Anomalies
Site 12
Site 16
Site 73
Other Local Anomalies
Sites 65 and 67
Chemical Composition of Water Samples
Water Salinity
Chemical Composition
Comparison with Regional Trends
Comparison of Soil and Water Salinity with Measured Conductivity
DISCUSSION
Effectiveness of Airborne Geophysics
Geophysical Profile of a Leaking Well
Utility of Airborne and Ground-Based Geophysics
CONCLUSIONS
ACKNOWLEDGMENTS
REFERENCES
APPENDIX A. Hatchel area geophysical sites
APPENDIX B. Chemical composition of ground-water, surface-water, and oil-field-water samples
APPENDIX C. Chloride content and electrical conductivity of soils collected in this study in Runnels County
Figures
1. Map of the Hatchel, Texas, quadrangle
2. Generalized geologic map of the Hatchel quadrangle
3. Soil map of the Hatchel quadrangle
4. Total dissolved solids in brine from Guadalupian Series oil fields
5. Potentiometric surface of brine in Guadalupian Series based on equivalent fresh-water hydraulic head
6. Conceptual model of West Texas salinity sources
7. Oil- and gas-well locations in the Hatchel quadrangle
8. Photograph of helicopter lifting DIGHEM magnetometer and EM birds in preparation for airborne geophysical survey
9. Photograph of RRC worker using a metal detector to locate an abandoned well
10. Photograph of Bureau worker using Geonics EM34-3 ground-conductivity meter to perform reconnaissance EM survey
11. Exploration depth of various coil separations and orientations of the EM34-3
12. Protem 47/S transmitter input and receiver response
13. Instrument configuration of Protem l LEM sounding
14. Photograph of LCRA and CRMWD staff sampling a water well
15. Location of water and soil samples collected by CRMWD, LCRA, and the Bureau
16. Map of enhanced total magnetic field strength
17. Map of shallow ground conductivity at 56,000 Hz, vertical dipole coil orientation
18. Map of moderately deep ground conductivity at 7,200 Hz, vertical dipole coil orientation
19. Map of deep ground conductivity at 900 Hz, vertical dipole coil orientation
20. Changes in estimated exploration depth with ground conductivity for 900-, 7,200-, and 56,000- Hz airborne EM coils
21. Transient decay and resistivity models for TDEM soundings at site 76
22. Transient decay and resistivity models for TDEM sounding at site 82
23. Transient decay and resistivity models for TDEM sounding at site 81
24. Transient decay and resistivity models for TDEM sounding at site 83
25. Transient decay and resistivity models for TDEM sounding at site 84
26. Transient decay and resistivity models for TDEM sounding at site 85
27. Transient decay and resistivity models for TDEM sounding at site 86
28. Transient decay and resistivity models at TDEM soundings at site 17A
29. Transient decay and resistivity models for TDEM sounding at site 87
30. Sketch map of site 76
31. Apparent ground conductivity at site 76, measured using multiple coil separations and horizontal and vertical dipole orientations
32. Two-layer conductivity models that fit multiple-coil-separation data for east-west line 76B and north-south line 76C at site 76
33. Sketch map of site 34
34. Apparent ground conductivity at site 34, measured using 20-m coil separation and horizontal and vertical dipole orientations
35. Sketch map of site 43
36. Apparent ground conductivity at site 43, measured using 20-m coil separation and horizontal and vertical dipole orientations
37. Sketch map of site 51
38. Apparent ground conductivity at site 51, measured using 20-m coil separation and horizontal and vertical dipole orientations
39. Photograph of vegetation-kill area adjacent to abandoned brine-disposal pit, site 17
40. Sketch map of site 17
41. Apparent ground conductivity at site 17, measured using multiple coil separations and horizontal and vertical dipole orientations
42. Sketch map of site 71
43. Apparent ground conductivity at site 71, measured using 20-m coil separation and horizontal and vertical dipole orientations
44. Sketch map of site 12
45. Apparent ground conductivity at site 12, measured using 20-m coil separation and horizontal and vertical dipole orientations
46. Sketch map of site 16
47. Apparent ground conductivity at site 16, measured using 20-m coil separation and horizontal and vertical dipole orientations
48. Sketch map of site 73
49. Apparent ground conductivity at site 73, measured using 20-m coil separation and horizontal and vertical dipole orientations
50. Photograph of abandoned Early A No. 2 well leaking saltwater at site 67 49
51. Sketch map of sites 65 and 67
52. Apparent ground conductivity at site 65, measured using 20-m coil separation and horizontal and vertical dipole orientations
53. Histogram of TDS in ground-, surface-, and oil-field-water samples in the Hatchel area
54. Relation between electrical conductivity and TDS and Cl content of water and soil samples
55. Chemical composition of hydrochemical facies in ground-, surface-, and oil-field-water samples in the Hatchel area
56. Relationship between Br :Cl ratio and Cl concentration in water samples collected during this study, compared with regional data presented by Richter and others (1990)
57. Relationship between Cl:S04 ratios and Na:Ca ratios in water samples collected during this study, compared with regional data presented by Richter and others
58. Comparison of TDS of ground-water samples and ground conductivity measured by 7,200- and 56,000-Hz surveys
59. Comparison of measurement of ground conductivity by airborne geophysical survey and measurement of Cl content and electrical conductivity of soil samples
Tables
1. Generalized stratigraphy of the Colorado River watershed
2. Summary statistics for airborne geophysical anomalies
Citation
Paine, J. G., Dutton, A. R., and Blum, M. U., 1999, Using Airborne Geophysics to Identify Salinization in West Texas: The University of Texas at Austin, Bureau of Economic Geology, Report of Investigations No. 257, 69 p.
